Overview
Data Audit inspects your datasets against the schema and business rules, analyzes the distribution and coverage of functions used in the data compared to the full list of available functions, and produces a structured report highlighting issues, anomalies, coverage gaps, and quality metrics. Use this feature to ensure your data meets quality standards before training or deployment.What Gets Audited
The audit examines multiple aspects of your data:- Schema Compliance - Adherence to expected schema format and business rules
- Data Completeness - Missing fields, incomplete records
- Function Coverage - How well your data covers the available function definitions
- Quality Metrics - Conversation flow, response quality
- Anomaly Detection - Outliers, unusual patterns, and inconsistencies
- Issue Identification - Categorized problems with specific recommendations
Parameters
If
schema_file or mcp_server_url is provided, the audit can additionally analyze function coverage, distribution, and error-function relationships against the full list of available functions’.Execution and Completion
After confirmation, the CLI displays a progress panel showing real-time status as each record is audited. The panel updates dynamically with elapsed time and current processing status.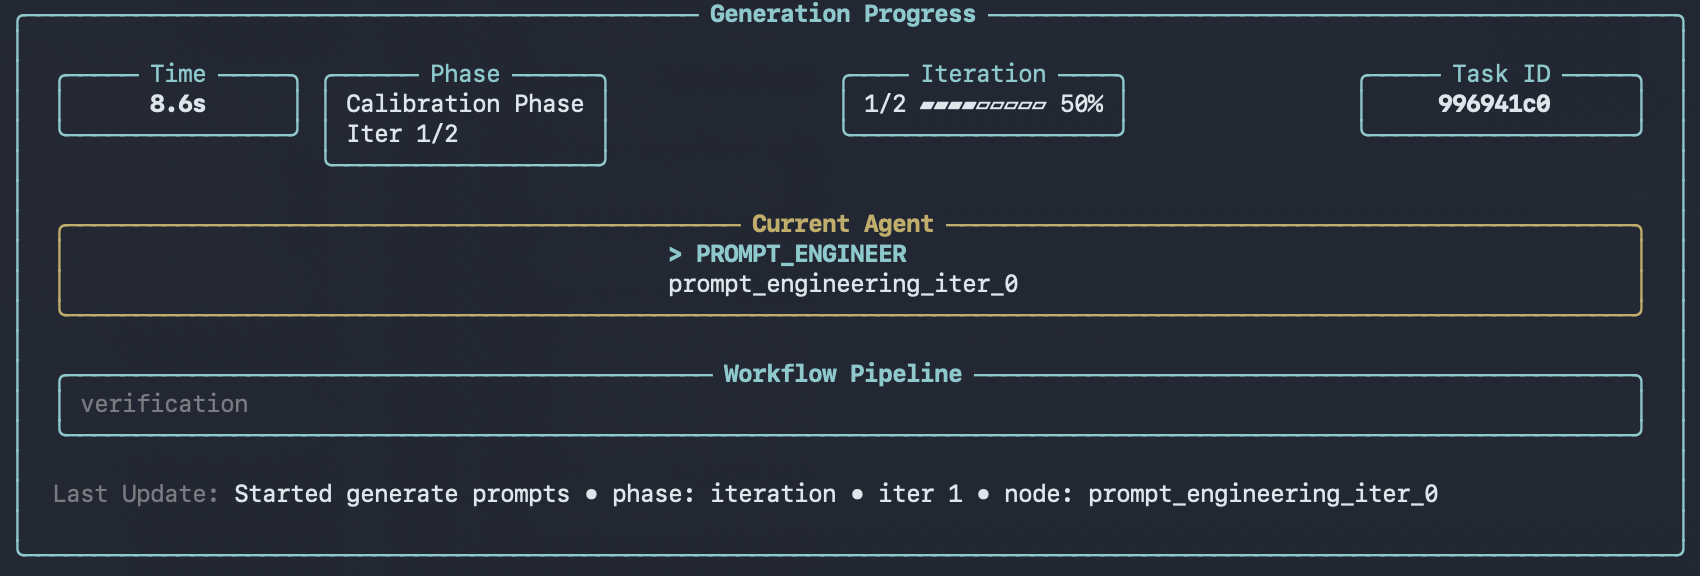
Audit Report Statistics
In addition to per-sample quality inspection, the audit generates dataset-level statistics that provide a high-level overview of your data. These statistics are displayed in the viewer after the audit completes.Tool Coverage
Shows how many of your defined functions are actually used in the dataset:- Supported functions total - Number of functions defined in your schema
- Involved functions total - Number of functions that appear in the data
- Coverage ratio - Percentage of schema functions represented in the data
- Uncovered functions - List of functions not used in any conversation
Function Distribution
Breaks down how frequently each function is called across all conversations:- Function name - The function identifier
- Count - Total number of calls
- Ratio - Proportion relative to all function calls
Error Distribution
Categorizes all issues found during the audit by type:- Error type - Category of the issue (e.g., missing parameters, invalid values)
- Count - Number of occurrences
- Ratio - Proportion relative to all errors
Error-Function Relationship
Maps which functions are associated with the most errors, helping you identify problematic tool definitions:- Functions with most errors - Ranked list of functions by error count
- Error types by function - Which error categories affect each function
Output
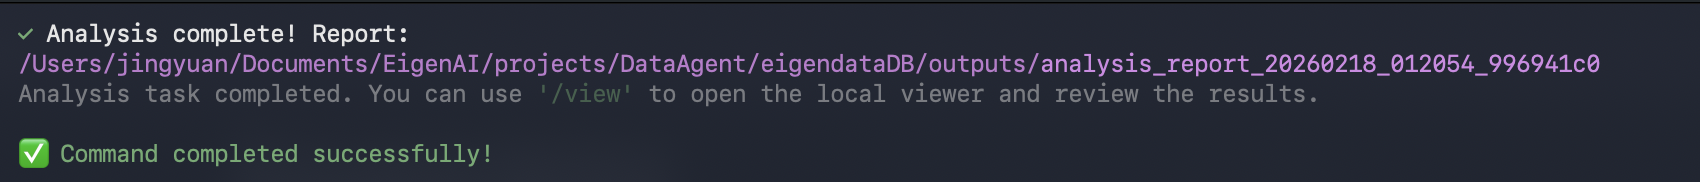
After a run completes, results are saved underoutputs/ as a new run directory, for example:
outputs/analysis_report_<run_id>/
analysis_report.json- The audit report (includes dataset-level statistics)metadata.json- Run metadata (task type, parameters, primary files, timestamps)
datapoints/ directory.
The viewer can browse and render these outputs.
Using /execute
You can also run data-audit non-interactively via/execute with a YAML config.
Prerequisites
- You have a YAML configuration file available.
- You configure a schema source via
/configure, or provide one in the YAML config (for example,mcp_server_url).